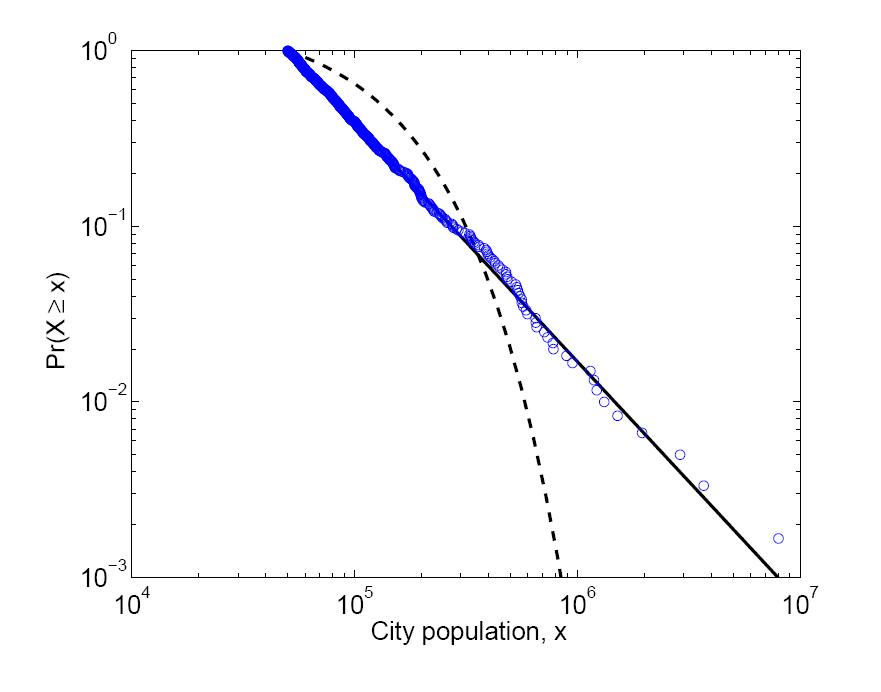
Plot the number of people killed in terrorists attacks around the world since 1968 against the frequency with which such attacks occur and you’ll get a power law distribution, that’s a fancy way of saying a straight line when both axis have logarithmic scales.
The question, of course, is why? Why not a normal distribution, in which there would be many orders of magnitude fewer extreme events?
Aaron Clauset and Frederik Wiegel have built a model that might explain why. The model makes five simple assumptions about the way terrorist groups grow and fall apart and how often they carry out major attacks. And here’s the strange thing: this model almost exactly reproduces the distribution of terrorists attacks we see in the real world.
These assumptions are things like: terrorist groups grow by accretion (absorbing other groups) and fall apart by disintegrating into individuals. They must also be able to recruit from a more or less unlimited supply of willing terrorists within the population.
Being able to reproduce the observed distribution of attacks with such a simple set of rules is an impressive feat. But it also suggests some strategies that might prevent such attacks or drastically reduce them in number . One obvious strategy is to reduce the number of recruits within a population, perhaps by reducing real and perceived inequalities across societies.
Easier said than done, of course. But analyses like these should help to put the thinking behind such ideas on a logical footing.
Ref: arxiv.org/abs/0902.0724: A Generalized Fission-Fusion Model for the Frequency of Severe Terrorist Attacks
Comments
5 responses to “The power laws behind terrorist attacks”
Nice post. I would quibble just a little by saying that–as we say in our abstract–we extended and generalized an existing model of the frequency of terrorist events of different sizes. The model is originally due to Neil F. Johnson and colleagues, and can be found on the arxiv. And their model was an adaptation of a similar model of herding behavior in financial markets. Finally, I’d point out that in addition to our mathematical analysis, we also describe a number of ways that the model can be tested with empirical data, which is an important next step before deciding that the model is a good explanation of terrorist attacks!
Hi Aaron—
How does the distribution of sizes of cities taken into account? I mean, superficially, I’d expect cities with smaller population (above some threshold, of course) to be attacked more frequently just because there are more such cities.
I think you mean that the power-law in the severity of terrorist attacks could come directly from the power-law in the size of cities. That is, terrorists might choose cities uniformly at random, and each attack killed some very small, but roughly constant, fraction of the inhabitants of the city. This was a possibility I considered in some of my earlier work, and when you do the analysis, you find that this simply isn’t true. The largest attacks do happen in large cities, but so do the smallest attacks. Numerically, there’s is no correlation between the city size and the attack size.
[…] laws behind terrorist attacks http://arxivblog.com/?p=1186 http://arxiv.org/abs/0902.0724 […]
I certainly enjoyed the paper, but I’ll raise a minor objection to the blog summary — the illustrative graph does not show the distribution of terrorist attacks, but rather the population of the 600 largest US cities (figure A1 in the paper under discussion). It should be noted that US cities do not exhibit a power law distribution across the whole range of populations, but only above a cut-off value of 100,000 or so.
To see the graph for terrorism deaths, one has to go to a really nice paper by Clauset, Shalizi, and Newman (arxiv:0706.1062v2 [physics.data-an] Figure 6.1). And at least to my eyeball, the graphical support for a power law relationship in that case is much less persuasive — what I assume are the 9/11 attacks have high leverage that compensates for the fact that the rest of the tail bends downward. To be fair, eyeballs shouldn’t be the final word, but the resampling procedure that Clauset et al used provides only what they deem “moderate” support a power law relationship. I’d be curious to see how the results changed if the largest point was left out of the dataset.
I see Clauset has posted here, so I’d like to not only thank him not only for a very fine paper, but also for being so forthcoming about the strengths and limitations of this model.